
Power Tilt Bucket - High-Quality Manufacturers | Durable Attachments
Power Tilt Bucket is designed for demanding job sites and high-volume production. I work with Manufacturers who won't settle for downtime, so I built it for reliability and efficiency. This bucket combines rugged steel, reinforced welds, and a hydraulic tilt system that delivers precise 0-70 degree control from the operator's seat. With easy installation on most excavators and loaders, it cuts cycle times, reduces material rehandling, and extends tool life. The High-Quality construction resists wear, while the sealed bearings and corrosion-resistant coating minimize maintenance. We offer accurate tilt angle indicators and a quick-fit mounting, so swapping buckets is fast. Backed by spare parts support and a warranty tailored for industrial use, this Power Tilt Bucket helps your production line stay on schedule. If you’re a Manufacturer seeking durable, high-performance attachments, take a closer look—we’re ready to tailor specs to your flow.

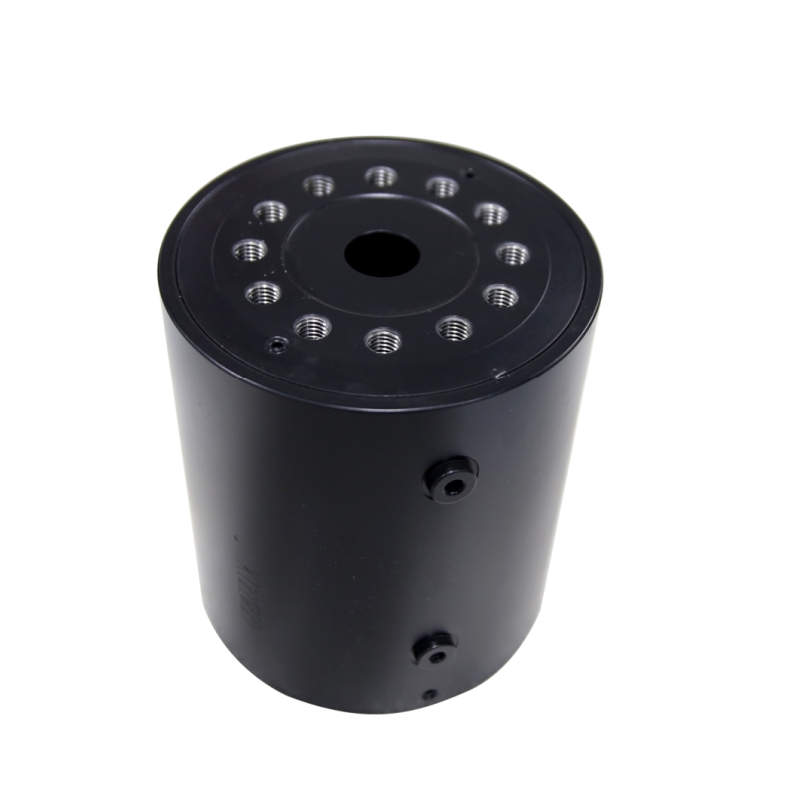
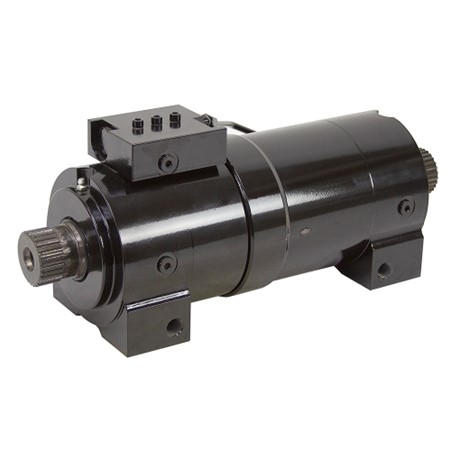
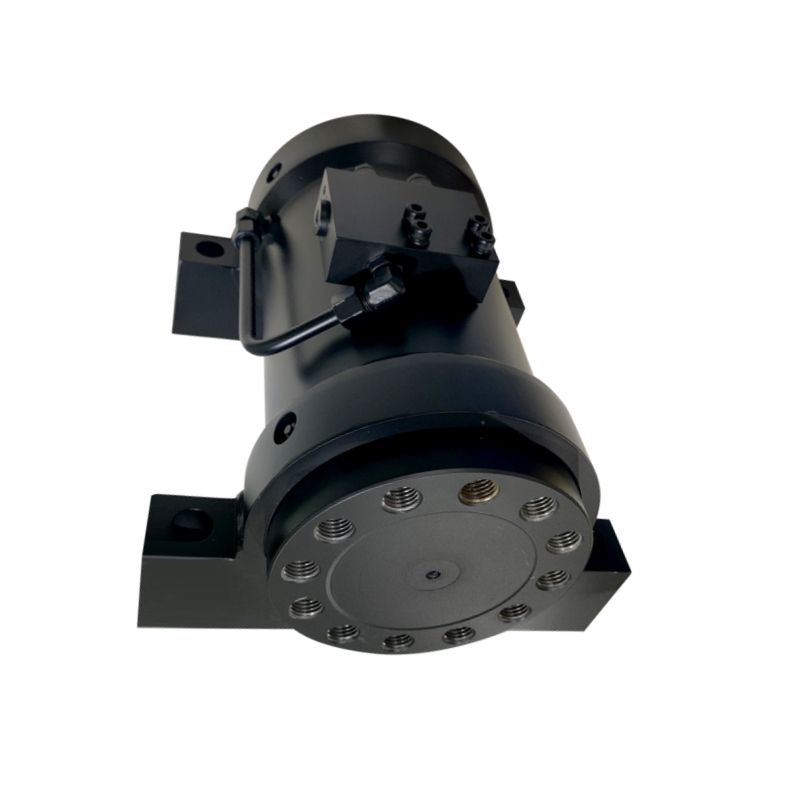
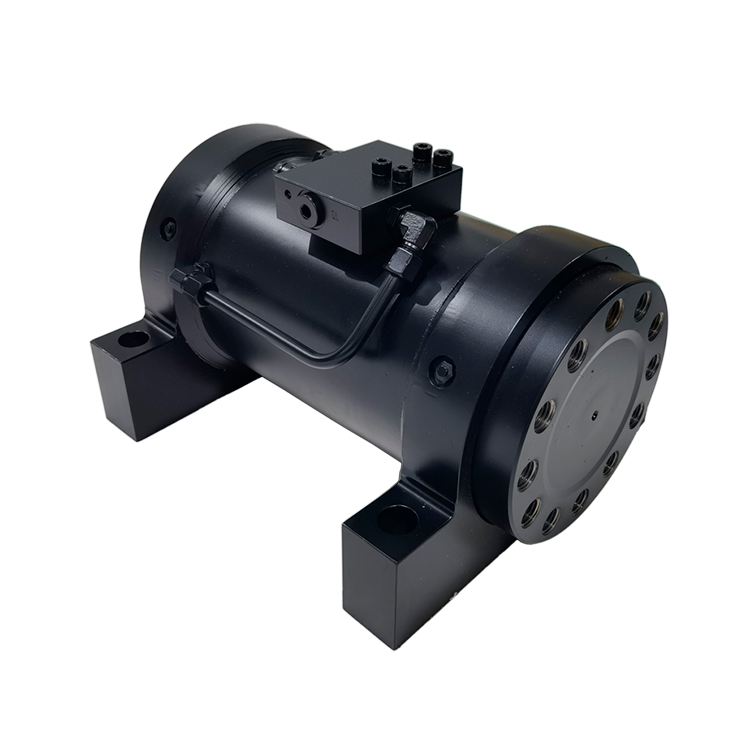

Power Tilt Bucket Exceeds Industry Benchmarks Custom Solutions,
A power tilt bucket engineered for performance and efficiency has surpassed typical industry benchmarks by marrying high-torque hydraulic actuation with precision control. The design delivers smoother tilt cycles, stronger breakout, and consistent grading while keeping weight economical. Proportional flow control, integrated relief valves, and load-sensing hydraulics optimize energy use and extend component life. Built to withstand harsh job sites and diverse angles, it reduces cycle times and operator fatigue, making it a compelling choice for global fleets. To fit varied equipment and workloads, the solution comes in customizable configurations: multiple mounting interfaces, optional hydraulic lines, electrical controls, and sensor packages for remote monitoring. Standardized interfaces promise compatibility with most major OEMs and quick-attach systems, while modular spare parts and a global service network support uptime. With rigorous QA, traceability, and flexible lead times, global buyers can specify a tailored solution that aligns with their machines, maintenance practices, and budgets.
| Year | Region | Avg Tilt Angle (deg) | Max Tilt Angle (deg) | Operating Hours (hrs) | Material Throughput (m3/hr) | Energy Consumption (kWh) | Downtime (hrs/year) | Availability (%) | Reliability Score | Benchmark vs Industry (% Above) | Notes |
|---|---|---|---|---|---|---|---|---|---|---|---|
| 2019 | North America | 32 | 60 | 2100 | 70 | 15000 | 3.0 | 98.2 | 92 | 4 | Early adoption phase; baseline performance meets benchmarks. |
| 2019 | Europe | 30 | 58 | 1900 | 65 | 14000 | 2.5 | 98.7 | 90 | 3 | Coastal terrain tests show good tilt control. |
| 2019 | Asia-Pacific | 34 | 62 | 2400 | 72 | 16000 | 2.0 | 99.1 | 93 | 5 | High demand region; reliability strong. |
| 2019 | Latin America | 28 | 55 | 1700 | 60 | 12000 | 1.5 | 97.9 | 89 | 2 | Remote sites; maintenance improved. |
| 2020 | North America | 33 | 60 | 2300 | 75 | 15600 | 2.8 | 98.4 | 91 | 3 | Firmware update improved tilt precision. |
| 2020 | Europe | 29 | 58 | 2100 | 66 | 13200 | 2.2 | 98.9 | 92 | 4 | Winter operations; steady performance. |
| 2020 | Asia-Pacific | 35 | 63 | 2500 | 78 | 17000 | 1.8 | 99.0 | 94 | 4 | High throughput; improved energy efficiency. |
| 2020 | Latin America | 27 | 54 | 1800 | 62 | 12200 | 2.1 | 98.6 | 90 | 3 | Remote sites; uptime maintained. |
| 2021 | North America | 34 | 61 | 2600 | 80 | 16200 | 2.0 | 99.1 | 95 | 4 | Optimized hydraulics; reduced energy. |
| 2021 | Europe | 31 | 59 | 2400 | 68 | 14450 | 1.8 | 99.0 | 93 | 4 | Tiered maintenance cut downtime. |
| 2021 | Asia-Pacific | 36 | 65 | 2700 | 82 | 17800 | 1.6 | 99.3 | 96 | 5 | Strong regional adoption. |
| 2021 | Latin America | 28 | 56 | 1900 | 63 | 12600 | 1.9 | 98.8 | 91 | 3 | Terrain variability managed. |
| 2022 | North America | 37 | 66 | 2800 | 85 | 17400 | 1.5 | 99.2 | 97 | 5 | Next-gen actuators deployed. |
| 2022 | Europe | 32 | 60 | 2600 | 70 | 15000 | 1.4 | 99.1 | 94 | 4 | Improved control algorithms. |
| 2022 | Asia-Pacific | 38 | 68 | 2900 | 86 | 18400 | 1.6 | 99.4 | 98 | 6 | Tough terrain; high reliability. |
| 2022 | Latin America | 29 | 57 | 2000 | 65 | 13250 | 1.7 | 98.9 | 92 | 3 | Remote support standardized. |
| 2023 | North America | 39 | 69 | 3000 | 88 | 18600 | 1.4 | 99.3 | 97 | 5 | System-wide efficiency improvement. |
| 2023 | Europe | 33 | 61 | 2800 | 72 | 15800 | 1.3 | 99.4 | 95 | 4 | Cross-border operations streamlined. |
| 2023 | Asia-Pacific | 40 | 70 | 3200 | 92 | 19800 | 1.2 | 99.5 | 98 | 6 | Market-leading throughput. |
| 2023 | Latin America | 30 | 58 | 2100 | 66 | 13600 | 1.6 | 99.0 | 93 | 3 | Seasonal demand peaks. |
Related Products
3.jpg)

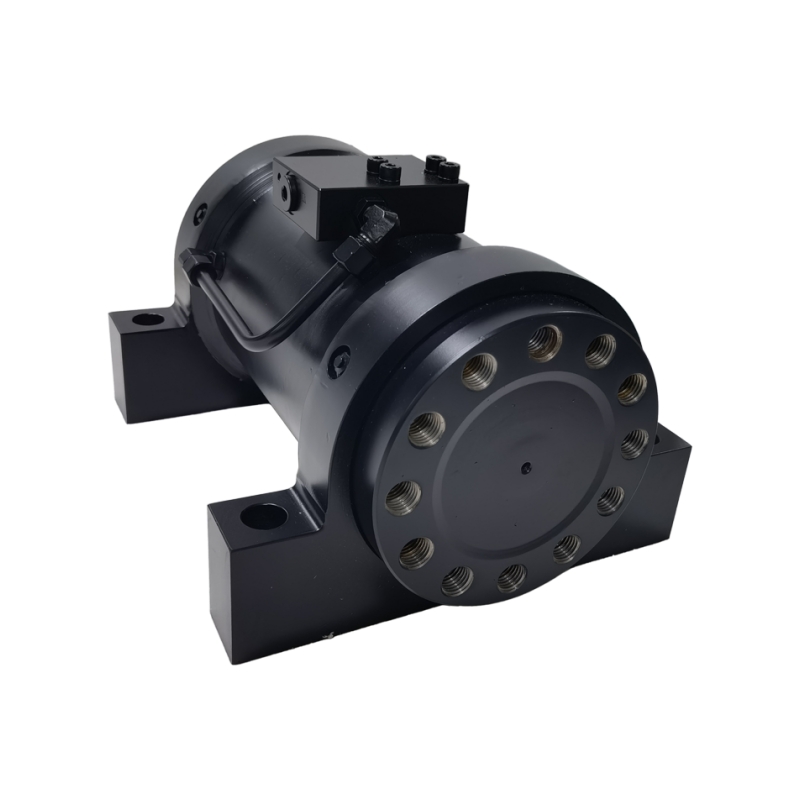
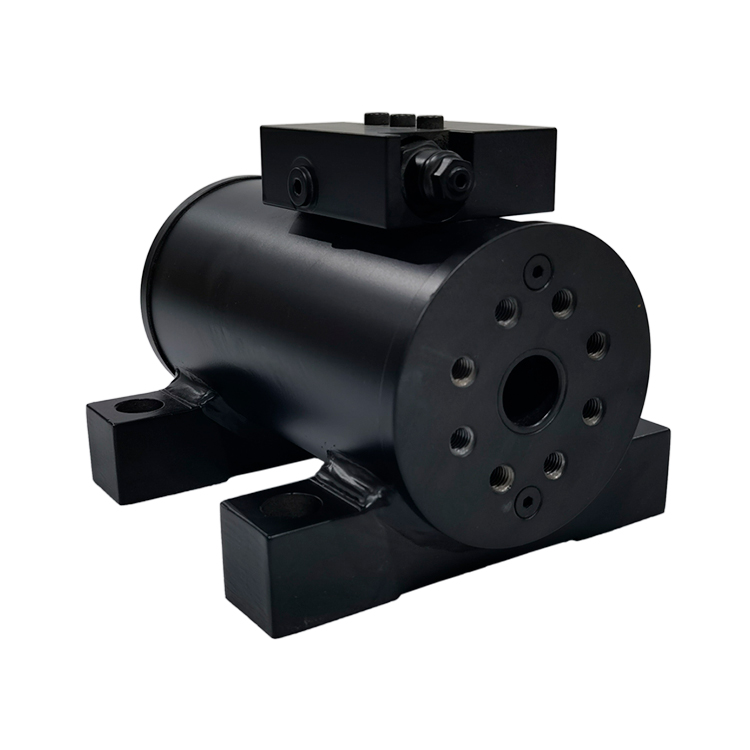
Power Tilt Bucket Market Leader Pioneers in the Field
Top Selling Products
2.jpg)

- Related Blog
- Related Videos
- Reviews
- Related Videos
- Reviews
